Summary by James R. Martin, Ph.D., CMA
Professor Emeritus, University of South Florida
Accounting Theory Main Page
| Relevant Cost Main Page
Opportunity costs have been defined in different ways in economics and accounting. Some definitions include:
1. Costs that are foregone opportunities that have been sacrificed,
2. The maximum alternative earnings that might have been obtained if another alternative had been chosen,
3. The change in cost following the adoption of an alternative machine, process, raw material, specification, or operation.
4. The highest alternative use value of resources used up or committed to a particular use.1
As indicated above some definitions define opportunity cost in terms of cost, while others define the concept in terms of earnings or value. The alternative definitions have caused some confusion, particularly to students who are generally unable to apply the concept in problem situations. The purpose of this article is to help students understand and apply the concept of opportunity cost using examples based on the static inventory problem under risk. In this type of problem it is assumed that only one order is possible and that the probability distribution of demand is known. Then the construction of profit and opportunity cost matrices can be used to illustrate and reinforce the operational definitions of opportunity cost.
Example 1: A merchant is considering ordering a seasonal item (e.g., Christmas trees, Valentine candy, or newspapers) that will have no market value beyond the seasonal period.
Sales price if sold = $10
Unit cost if purchased
= $6
The demand in units and probability of selling those quantities is as follows:
5(.1), 6(.2), 7(.3), 8(.3), and 9(.1).
Which order quantity should be chosen? The solution can be determined by developing a profit matrix or an opportunity cost matrix, i.e., finding the order level that maximizes profit, or minimizes opportunity cost.
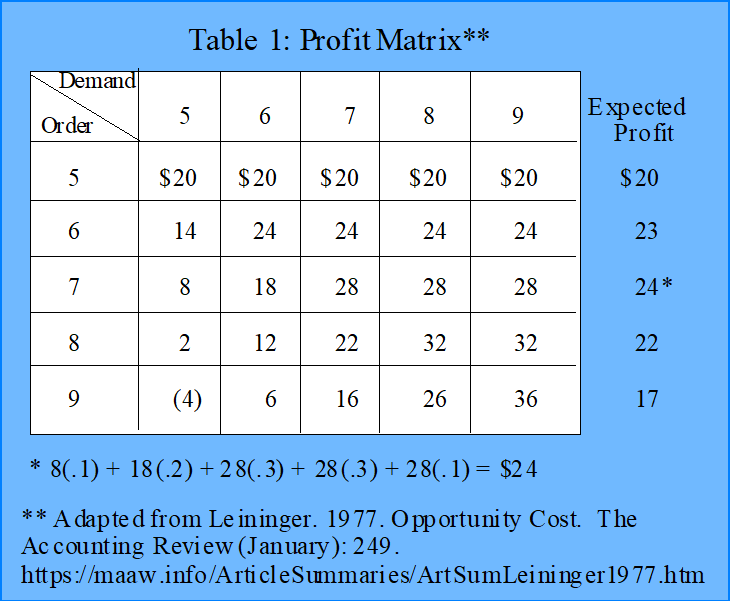
The profit matrix for this example is provided in Table 1 below:

As illustrated above the merchant should order seven units with an expected profit of $24. The profit for each cell in the matrix is the $4 profit from each unit sold, less the $6 loss from each unit purchased but not sold. For example, if the merchant orders 7 and only sells 5, the profit is only $8 because the profit is $20 for the five units sold, less $12 for the two units purchased, but not sold.
Note that the expected profit for each size order is found by multiplying the profit for each level of demand by the related probability for that demand level. For order size 7 the expected profit is 8(.1) + 18(.2) + 28(.3) + 28(.3) + 28(.1) = $24.
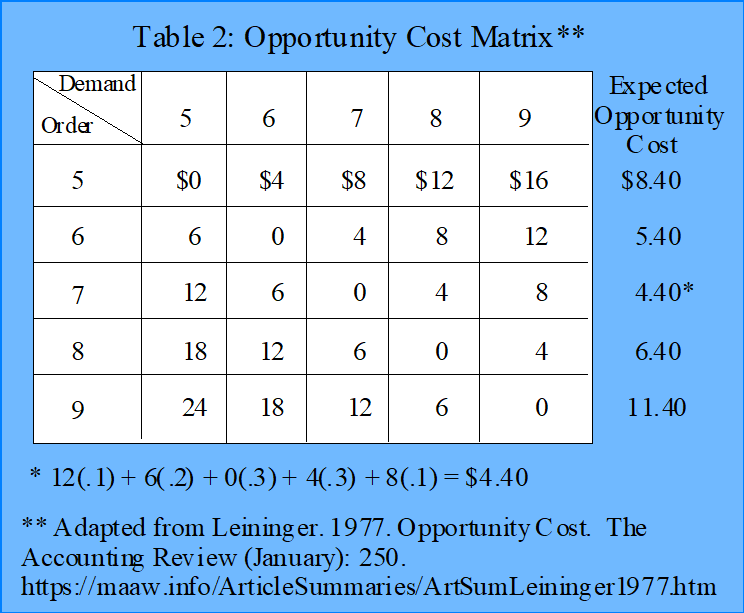
To solve the problem using opportunity cost, we need an operational definition of the term. For this purpose, opportunity cost is defined as the difference between the profit that would have been obtained from choosing the best alternative, and the profit obtained from the chosen alternative. The opportunity cost matrix for this example is provided in Table 2 below:

Note that the lowest expected opportunity cost is $4.40 for an order level of 7 units. The opportunity cost for each cell in the matrix is either the unrealized profit from not having enough inventory to meet demand, or the loss from having more inventory than could be sold. For example, if the merchant orders 7 and only sells 5, the opportunity cost is $12 for the two unsold units. The expected opportunity cost for each size order is found by multiplying the opportunity cost for each level of demand by the related probability for that level of demand. For order level 7 the expected opportunity cost is 12(.1) + 6(.2) + 0(.3) + 4(.3) + 8(.1) = $4.40
Example 2: A merchant needs to order sets of spare parts for a refrigeration system. He can place one order for spare parts at $500 per set. If the system fails and the parts are not available the company will incur a cost of $2,000. The number of possible failures and their probabilities are as follows: 0(.2), 1(.4), 2(.2), 3(.1), 4(.1).
How many sets of parts should be ordered? The solution can be determined by developing a cost matrix or an opportunity cost matrix, i.e., finding the order level that minimizes cost, or minimizes opportunity cost.
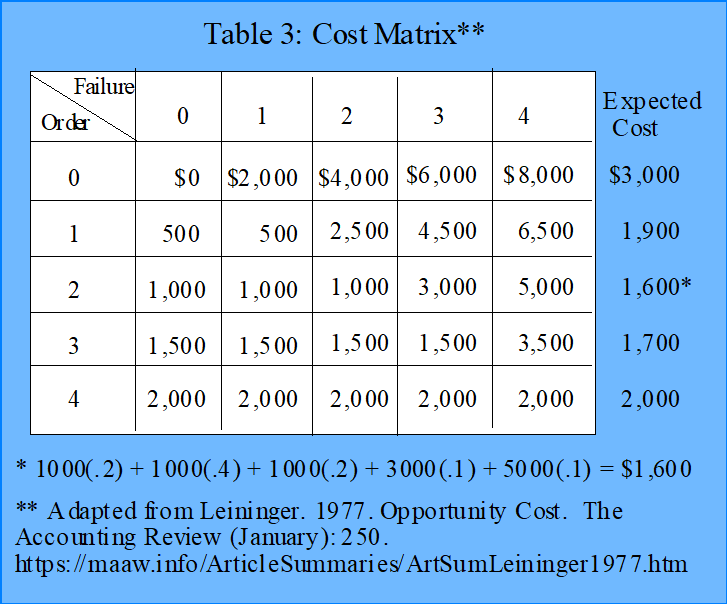
The cost matrix is illustrated in Table 3 below.

To minimize the expected cost involved the merchant should order two sets of spare parts as indicated in Table 3.
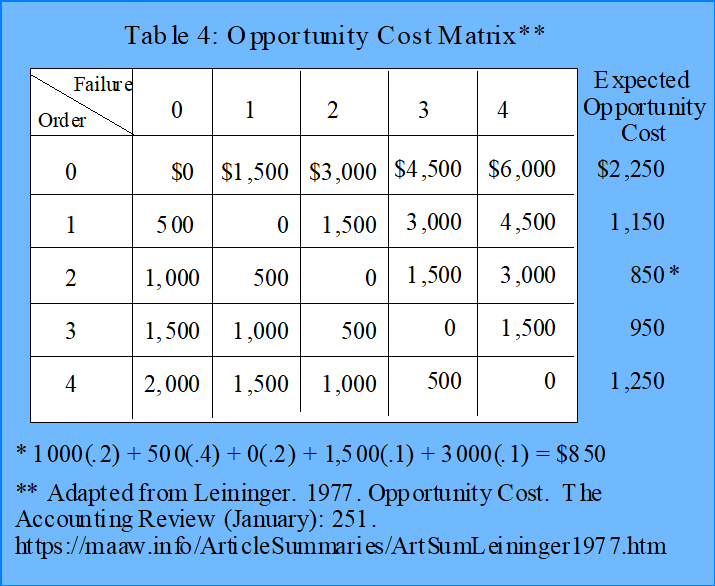
To solve the problem in terms of opportunity cost we need another operational definition of the term. For this purpose opportunity cost is the difference between the cost incurred and the cost that would have been incurred if the best alternative quantity had been chosen. The resulting opportunity cost matrix is shown in Table 4 below.

As you can see from Table 4 the solution is to order two sets of spare parts, i.e., that order quantity minimizes the expected opportunity cost. The opportunity cost in each cell in the matrix is either the cost of the unused parts sets, or the failure cost above what the order cost would have been if the correct number of spare parts sets had been ordered.
According to Leininger this type of in-class exercise together with several out-of-class exercises helps students gain the necessary insight into the meaning of opportunity cost.
___________________________________
Footnote:
1 See the Solomons summary below.
Related summaries:
Martin, J. R. Not dated. Management accounting terminology. Management And Accounting Web. (Management Accounting Terminology).
Oser, J. 1963. The Evolution of Economic Thought. Harcourt, Brace & World, Inc. See Wieser in Chapter 13. (Summary).
Solomons, D. 1966. Economic and accounting concepts of cost and value. In Backer, M. ed. 1966. Modern Accounting Theory. Prentice-Hall Inc. Chapter 6: 117-140. (Summary).