Chapter 4
Traditional Cost Management Systems
Study Guide by James R. Martin, Ph.D., CMA
Professor Emeritus, University of South Florida
ABKY Main Page |
Martin's Textbook Main Page
The main topics in this chapter are related to cost accumulation and cost allocation. The authors discuss job order costing and job cost bit sheets in the first section. The second section describes cost driver rates for activity costs. The traditional term for "cost driver rates" is "factory overhead rates". They use the newer term to promote the activity based approach, but the term "cost driver rates" was not used in traditional cost systems. This section includes a discussion of how these overhead or driver rates are determined and why they believe the rates should be based on the long term capacity made available. This section is followed by an example to show why multiple rates are frequently needed to prevent cost distortions. The last section in the chapter compares job order costing with process costing or multistage process costing. Chapter 4 also includes an extensive appendix related to the two stage allocation process for service department costs.
2. What is a Cost Accounting System and How do Job Order costing and Process Costing Fit into the System?
The illustration below shows the various components needed to develop a cost accounting system. One component from each of the five categories is required for an operational cost system, along with many details such as source documents and general ledger accounts. My purpose for placing Exhibit 2-1 in this summary is not to introduce all of the terminology included in the exhibit, but to point out that job order costing and process costing are cost accumulation methods, not complete cost systems. These are subsystems that indicate whether manufacturing costs are accumulated by: 1) job or order, or 2) department or process. Job order cost accumulation is appropriate where products or services are produced to customer specifications. Process costing is appropriate where identical products are mass produced in a sequence of processes or departments. Then the costs are allocated to individual products based on an average that varies depending on the cost flow assumption used. For more discussion on the components in Exhibit 2-1 see What is a cost accounting system or MAAW's Textbook Chapter 2.

3. Determining Activity, Cost Driver, or Overhead Rates
Purpose : Activity rates, cost driver rates, or overhead rates, are developed for the purpose of assigning indirect costs or support costs to products. All of these terms have similar meanings. The terms "activity rates" and "cost driver rates" are used in the activity based costing literature, while the term "overhead rates" is an older term associated with traditional cost accounting systems. In traditional cost systems the overhead rates were usually determined for each producing department, typically one rate per department. Most of these rates were based on a single production volume based measurement like direct labor hours or machine hours. These rates were calculated as follows:
Overhead rate = Estimated indirect costs for the period ÷ Estimated activity level
The most popular activity level used in the denominator has been the planned capacity level. The basis for the denominator in the rate calculations is controversial and ABKY do not agree with the calculation above. They show the following calculation on page 118.
Activity cost driver rate = Normal cost of support activity ÷ Normal level of driver
where normal level is defined as the long run capacity made available.
The activity in their example is machining. Annual cost = $900,000. Normal capacity is 20,000 machine hours. The activity rate is 900,000 ÷ 20,000 = $45.
Then products are charged with $45 of machining costs per machine hour used.
4. Why use Long Run Capacity as the Denominator?
First , if the activity rates are calculated frequently based on expected demand (e.g., by month, or by quarter as in the example on page 119), product costs would vary from month to month, or quarter to quarter, and cause bid prices to fluctuate and create problems for the company. ABKY mention a death spiral on page 119 where high prices created during low volume periods could lead to even lower demand and even higher prices in subsequent periods.
Second , using long run capacity as the basis for the denominator provides more accurate product costs by allowing for the separation of costs into the cost of capacity used and the cost of capacity unused. When the activity costs are assigned to products, only the cost of capacity used is assigned. The death spiral argument also applies here. If annual activity rates are based on planned or expected activity volume, unused capacity cost will be assigned to products and the potential for over pricing products will exist. But note as indicated above, this is a controversial topic.
The reason for using multiple rates is to avoid product cost distortions . ABKY show this with an example that appears on pages 119-123. When the labor costs for two types of mechanics (expert and regular) are lumped together to determine a single activity rate, the simple jobs are over charged and the complex jobs are under charged. Using separate rates for the two types of mechanics solves the problem. This is another simple example of how the activity based approach is used to provide more accurate costs.
Determining the number of cost pools and activity rates is based on the tradeoff between cost and benefit. Increasing the number of cost pools increases the cost of measurement, but decreases the cost of errors in decisions. This tradeoff is illustrated in ABKY's Exhibit 4-8 on page 125.
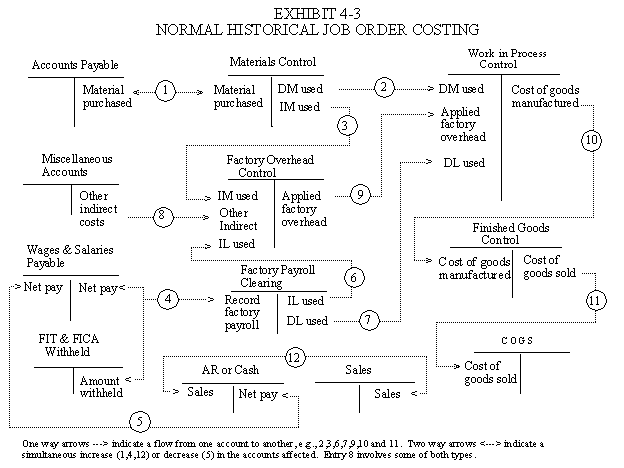
The ABKY section on pages 125-127 shows how actual costs are recorded on job cost sheets. In the illustration below (from MAAW's Textbook Chapter 4), job cost sheets serve as the supporting records (subsidiary accounts) for work in process and finished goods. The illustration shows the general ledger accounts in T-account form for a normal historical job order cost system. Cost sheets are an important part of this type of system, but there are many other components. Actual resource costs (direct material, direct labor, and support) are recorded and flow through a set of perpetual inventory accounts as shown. When the products (jobs) are sold, the costs are transferred from finished goods to cost of goods sold. For a complete explanation of this illustration, along with an example, click on the Chapter 4 link above.

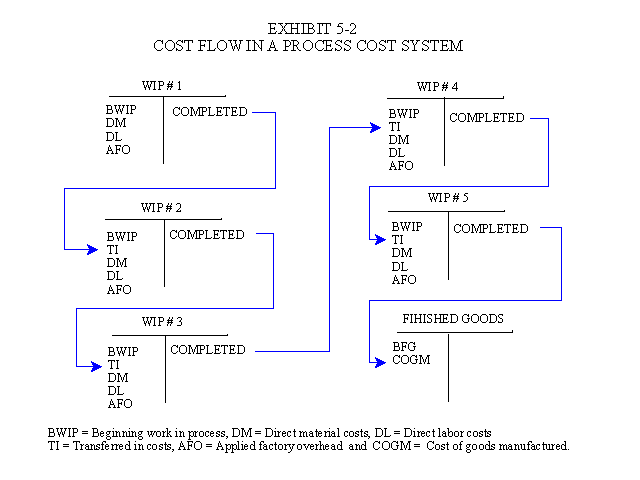
Process costing is a cost accumulation method used where the work performed on each unit is standardized, or uniform, in a continuous mass production or assembly operation. Costs are accumulated by departments, operations, or processes. For example, process costing is used by companies that produce appliances, alcoholic beverages, tires, sugar, breakfast cereals, leather, paint, coal, textiles, lumber, candy, coke, plastics, rubber, cigarettes, shoes, typewriters, cement, gasoline, steel, baby foods, flour, glass, men's suits, pharmaceuticals and automobiles. Process costing is also used in meat packing and for public utility services such as water, gas and electricity. ABKY show an illustration on page 131 of a chemical company process involving several process stages including mixing and blending, reaction chambers, and pulverizing and packing. The illustration below (from MAAW's Textbook Chapter 5) shows how costs flow from one stage or process to another. Costs assigned to products in one stage are transferred to the next stage so that product cost accumulate to determine the final product costs that are transferred to finished goods.
8. T-ACCOUNT VIEW OF PROCESS COST FLOW

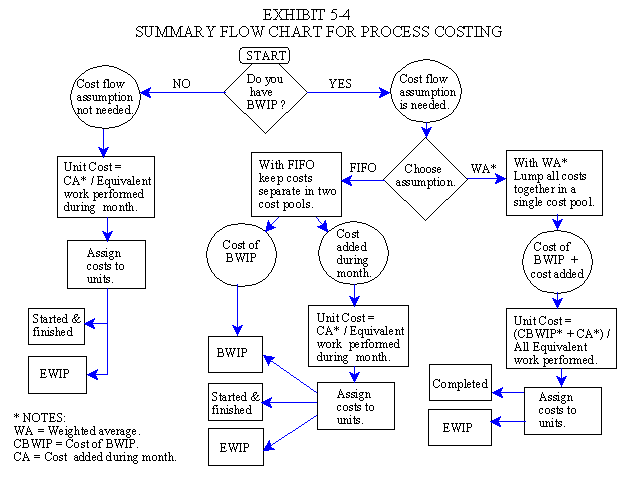
The main problem in process costing is determining the average product cost for each process. An average cost is needed so that the cost transferred to the next process can be separated from the cost of the ending inventory that remains in process. How the average is determined depends on the cost flow assumption chosen. The graphic illustration in Exhibit 5-4 (from MAAW's Textbook Chapter 5) provides a conceptual view of the calculations that are involved in process costing. Cost accounting textbooks typically include a lot of detailed process costing illustrations and problems. Our purpose here is to grasp the general concepts, not the operational details. ABKY's Exhibit 4-12 on page 131 helps distinguish between process costing and job order costing.
9. Flow Chart for process Costing

10. Service Department Cost Allocations
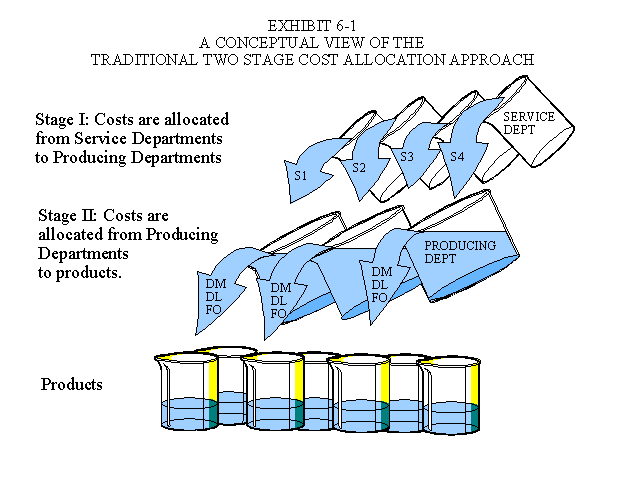
The various functional areas within a manufacturing facility are usually separated into producing departments and service departments. Producing departments convert raw, or direct materials into finished products. Service departments provide support services to the other departments in the plant. Some examples of service departments include purchasing, receiving and storage, engineering, power, maintenance, packing, shipping, inventory control, inspection and quality control. Service department costs must be assigned (applied, allocated, or traced) to the inventory for product costing purposes. ABKY's Exhibit 4-16 and Exhibit 6-1 below (from MAAW's Textbook Chapter 6) show conceptual views of the traditional two stage cost allocation approach. Service department costs are allocated to producing departments in stage one using a convenient basis, e.g., book value of machines for maintenance, (See p. 136). Then producing department cost are allocated to products using a production volume related measurement such as direct labor costs.

In a service organization, the terms revenue producing and non-revenue producing departments might be used rather than the terms production departments and service departments. However, the concept of allocating, or tracing cost from non-revenue (support) departments to revenue producing departments is just as applicable as it is in manufacturing. For example, support costs need to be traced to facilitate strategic decisions such as introducing new services, discontinuing services, pricing services and outsourcing services.
11. Stage One Allocation Methods
ABKY discuss three methods for allocating service department costs to producing departments. These include: 1) the direct method, 2) the step-down or sequential method and 3) the reciprocal method. A summary of these methods appears below.
| First Stage Allocation Method | Recognition of Self Service |
Recognition of Reciprocal Service |
Procedure for Allocations | Level of Difficulty | Level of Accuracy |
| Direct | Ignores self services, e.g., maintenance of the maintenance department, or power consumed by the power plant. | Ignores services provided from service departments to other service departments. | Cost are allocated directly from service departments to producing departments. | Easy | Least accurate. Distorts the cost of the services for outsourcing decisions, as well as product costs. |
| Sequential or Step-down | Ignores self services. | Partially recognizes reciprocal services as service departments are closed in a prescribed sequence. | Cost are allocated in a sequence from service departments to some other service departments and to producing departments. | Difficult and time consuming to establish the sequence of allocations. Sequential method problems in textbooks are the most difficult to solve. | More accurate than the direct method, but still distorts the cost of the services for outsourcing decisions, as well as product costs. |
| Reciprocal | Fully recognizes self services. | Fully recognizes reciprocal services. | Allocations are made based on the solution to a set of simultaneous equations that represent all the relationships. | Fairly easy to write equations representing relationships. Computer software needed to solve realistic set of equations. | Most accurate for both outsourcing decisions and product cost decisions. |
12. Two Stage Allocation Cost Distortions
The two stage cost allocation approach does not establish an accurate link between the causes of support costs and the products produced. The main cost distortions occur in the second stage where indirect costs are allocated to products ignoring the relationships between the products and the service activities. ABKY illustrate this on page 142. Using setup costs as an example of support cost, they show how a traditional stage two calculation would assign the cost to two products (A and B) based on a production volume related measurement such as machine hours. Since product A is a high volume product relative to product B, (800 units of A compared to 200 for B), it generates a larger number of machine hours and is charged with more than its fair share of the setup costs. The problem is that setup costs are related to the number of batches, not the number of units produced. The solution according to ABKY is to allocate the setup costs based on a batch related measurement such as setup hours. This is an example of how non-production volume related measurements are used in activity based costing. ABC is the topic in the next chapter. See ABKY pages 90-93 in Chapter 3 to review the cost hierarchy concepts.
* What is a cost accounting system and how do job order costing and process costing fit into the system? (See item 2 above).
1. Why are costs estimated for individual jobs?
2. What information is presented in a typical job bid sheet?
3. What is the source of the information to estimate the cost of materials?
4. What is the source of the information to estimate the direct labor costs?
5. How are support cost (overhead) driver rates determined? (See the example in item 3 above).
6. How is support cost estimated for individual jobs? (See item 3 above).
7. What is the markup rate? On what factors does it depend?
8. What is a cost pool? Why are multiple cost pools required? (See item 5 above).
9. What problem arises when cost driver rates are based on planned or actual short-term usage instead of normal usage? (See item 4 above and Problem 4-26).
10. What is the normal cost of a support activity? What is the normal usage of a cost driver? (See item 3 above).
11. Use of a peanut-butter-spreading approach of a single cost driver rate when there are multiple cost drivers leads to distortions in job costs. Do you agree with this statement? Explain. (See item 5 above).
12. What are cost pools? How is the appropriate number of cost pools selected? (See Cost/benefit Graphic).
13. What is the managerial use of tracking actual costs of individual jobs? (See item 6 above).
14. Why are predetermined cost driver rates used when recording actual job costs? (Item 6 above is related to this question).
15. What does the term conversion costs mean?
16. What is the basic procedure for determining product costs in continuous processing plants? (See item 8 and item 9 above).
17. What are the similarities and differences between job order costing and multistage process costing systems? (Compare item 6 with item 8 above).
18. What is the difference between production departments and service departments?
19. What are the two stages of cost allocations in conventional product costing systems? (See item 10 above).
20. Why do conventional product costing systems allocate service department costs first to production departments before assigning them to individual jobs?
21. What are the different situations for which direct, sequential, and reciprocal allocation methods are designed? (See item 11 above).
22. Why are conventional two-stage cost allocation systems likely to systematically distort product costs? (See item 12 above).
23. What are two factors that contribute to cost distortions resulting from the use of conventional two stage cost allocation systems? (See item 12 above).